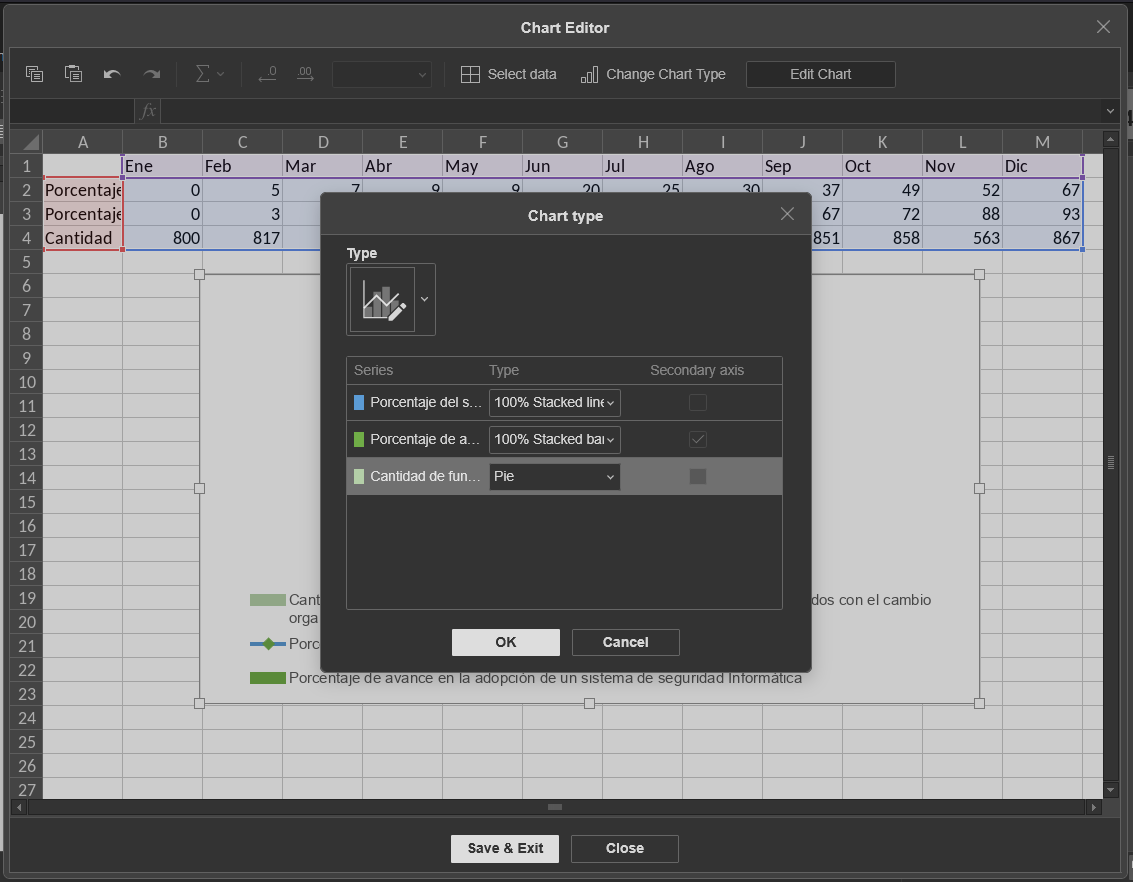
How can i build a custom chart like the one in the picture programatically?
In CreateChart there is a sample for a 3d bar, and also in the ChartTypes there is a comboCustom. I want to know how to build the CreateChart call to be comboCustom and how should i send the chart type for each dataset.
Thanks
Hey @edlacer, 
Thanks for sharing the screenshot and your question about! I haven’t tried creating one like this myself yet, so I’m curious — do you already have some macros or a starting point for this chart, or are you looking for guidance on how to structure the CreateChart call with comboCustom and specify chart types for each dataset?
If you’ve got any code snippets or specific details about what you’re aiming for, sharing those would help a ton.
Hey @Nikolas after some tinkering i landed on this, which is sort of what i want
let doc = Api.GetDocument();
let paragraph = doc.GetElement(0);
let chart = Api.CreateChart("comboCustom", [
	[200, 240, 280],
	[250, 260, 280],
    [75, 18, 60]
], ["Projected Revenue", "Estimated Costs"], [2014, 2015, 2016], 4051300, 2347595, 24);
paragraph.AddDrawing(chart);
let chartTypes=["barStacked3D", "doughnut", "stock"]
let allSeries = chart.GetAllSeries();
let series, seriesType;
for (let i = 0; i < allSeries.length; ++i) {
	series = allSeries[i];
    series.ChangeChartType(chartTypes[i])
	seriesType = series.GetChartType();
	paragraph = Api.CreateParagraph();
	paragraph.AddText((i + 1) + " Series Type = " + seriesType);
	doc.Push(paragraph);
}
I tested it here in the playground
1 Like